
Gold prices have broken out to fresh all-time highs in July, as the dollar continues to sink paving the way for the yellow metal. The story behind gold rapid rise has been two-fold. First, yields throughout the globe have headed south, as central banks have printed money. Second, the dollar has tumbled and since gold is generally quoted in US dollars, the decline in the greenback has buoyed gold prices. As investors scramble to find hard assets that will attain their value in a declining dollar environment, gold trading has become very active.
The US Yields Decline Buoying Gold Prices
As the spread of COVID-19 gripped the US, yields started to tumble. The 10-year Treasury yield is currently trading near 55-basis points, which is an all-time low. Investors have a choice whether to lend the US government money and receive 55-basis points a year for the next 10-years or find other assets that pay a higher yield. Alternatively, they can find assets that will pay no yield, like gold, but will outperform in a declining yield environment. The US is continuing to print money. The Fed is buying all the bonds it can and the US government is borrowing as they provide stimulus to the American people. The current 3-trillion and 2-trillion rescue packages require the government to borrow money by issuing treasuries.
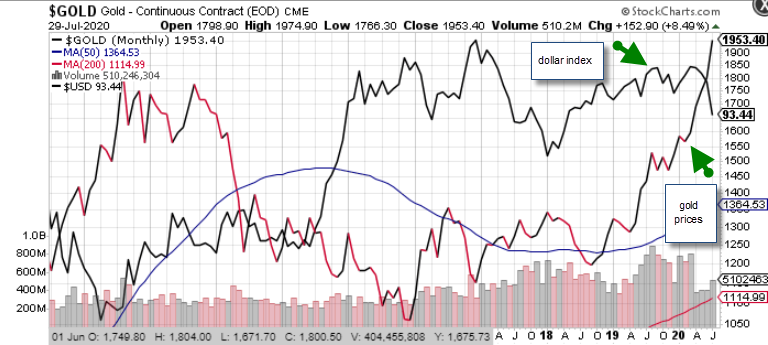
The drop in US yields, as weighed on the US dollar, as investors scramble to find hard assets that will not be diluted by the declining US dollar. You can see by the picture of the US dollar index and gold that the two assets are generally negatively correlated.
Correlation is a statistical study that measures if two or more assets move in tandem with one another. If assets are perfectly correlated and move in perfect tandem the correlation is 1. If the two assets move in opposite directions, the correlation is negative 1. If the assets show no observable correlation the coefficient is zero.
Since gold prices are quoted in US dollars there is a reason why they would be negatively correlated. If the dollar declines in value, gold prices become cheaper in other currencies. This occurs with many commodities such as oil, and agricultural products. If the dollar moves higher in value, gold becomes more expensive and needs to adjust lower to offset the rise in the US dollar.
Technical Analysis
Gold prices have hit fresh all-time highs against the US dollar, breaking out in July above the 2011 highs of $1,921. The move in the yellow metal has accelerated as the price broke through these all-time highs and should continue to remain above these levels as the US dollar remains under pressure.
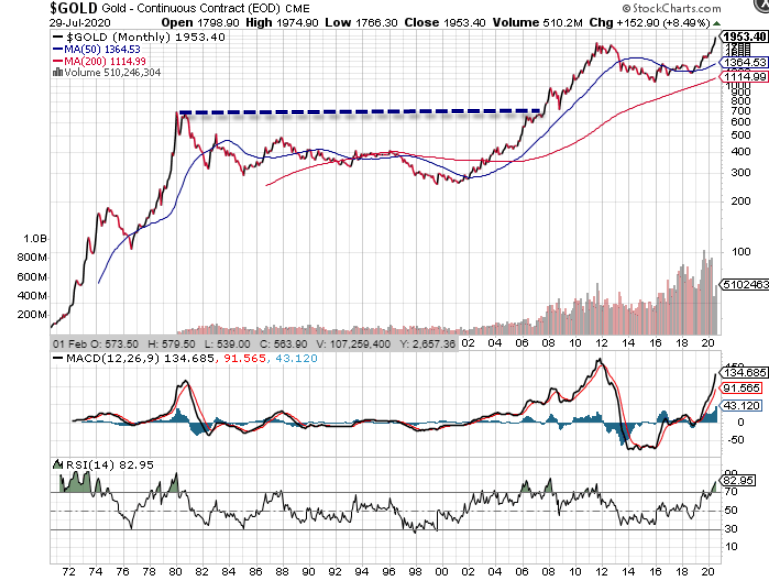
The last time gold prices broke out to all-time highs it rallied from $700 to $1921 between 2008 (the last financial crisis) to $19,21 in August of 2011. If this scenario were replicated, gold prices could rally to $5,271 over the next 4-years. Momentum on gold prices is positive a the MACD (moving average convergence divergence) histogram prints in the black with an upward sloping trajectory which points to higher prices. The relative strength index has also moved higher and is now in overbought territory. The current reading on the RSI is 83, above the overbought trigger level of 70, which could foreshadow a correction. The RSI reached a high of 82, in 2008, and a high of 86 in the 1970s, which means that prices can still run up as momentum continues to accelerate.
The Bottom Line
With the dollar continuing to trade under pressure and US yields likely to remain depressed, gold prices can continue to trade higher. Prior breakouts in gold prices have yielded higher levels for the yellow metal which are likely to occur given the current economic backdrop.